


Introduction
Due to its human teratogenic and carcinogenic properties, aflatoxin M1 (AFM1) poses a significant concern to the safety of milk. Among 450 different kinds of mycotoxins and their metabolites known (Akbar et al., 2020), most usually encountered mycotoxins that pose a significant health hazard to humans and animals involve aflatoxins, zearalenone, fumonisins, ochratoxin A, patulin and nivalenol (Chen et al., 2023). Aflatoxins are the most toxic among mycotoxins and are produced by the fungi belonging to the genus Aspergillus, mainly by Aspergillus flavus and Aspergillus parasiticus, but also by Aspergillus nomius, Aspergillus bombycis, Aspergillus orchraceoroseus, Aspergillus australis, and Aspergillus pseudotamarii and by genus Emericella (Emericella astellata and Emericella venezuelensis) (Picinin et al., 2013). The climate of tropical countries favours the extension of aflatoxigenic fungi.
The four common aflatoxins in food and agricultural commodities are aflatoxin B1 (AFB1), B2, G1, and G2. AFB1 has been known as a potent natural carcinogen in mammals, and its presence is predominant in food and feed. The order of toxicity of these naturally occurring aflatoxins is AFB1> aflatoxin G1>aflatoxin B2>aflatoxin G2 (Toteja et al., 2006). The occurrence of aflatoxins depends on various climatic factors; therefore, the degree to which contamination occurs varies with location, farming and agrarian practices and the extent to which things are susceptible to fungal annexation before harvesting or post-harvest processing times. Aflatoxins M1 and M2 are the hydroxylate metabolic products of AFB1 and B2, respectively. When cattle or other ruminants ingest aflatoxin-contaminated feed, cytochrome P450-associated enzymes convert aflatoxins AFB1 and AFB2 to AFM1 and AFM2 in the liver, and then these are excreted in dairy (Prandini et al., 2009). The agglomeration of AFM1 in milk is directly proportinal to the concentration of AFB1 present in fodders of milking animals and has been reported that 0.3%–596.2% of AFB1 which, when consumed by a dairy cow, is metabolized and transformed to AFM1, which is excreted in its milk (Tajkarimi et al., 2008). AFM1 regulatory limits in dairy and dairy products have been confirmed in numerous countries, with regulatory limits varying as per country commandment. The specific regulations limits depend upon the risk analysis studies. The European Union has the highest permissible limits for AFM1 in dairy for human consumption at 0.05 μg/L (Chen et al., 2023). The United States Food and Drug Administration (USFDA) and Food Safety and Standards Authority of India (FSSAI) had standardized the maximum acceptable limit for AFM1 analysis and dairy product at 0.5 μg/kg (Akbar et al., 2020). In view of the mentioned rationale, the present study designed a comprehensive assessment of AFM1 in raw milk.
Materials and Methods
A total of sixty hundred twenty (620) bulk tank milk samples were collected. The sampling of the milk was done proportionately to the population of bovines from these areas from milching animal irrespective of their breed and age group. As per the EpiInfoTM7 (CDC) software, by taking the total bovine population of the study area (Jammu) as 2,973,450 and the prevalence of AFM1 as 50%, taking 95% confidence level and 5% as a confidence limit the size of the sampling found to be “3,840”. However, 620 pooled milk samples cover around 6,620 individual milch animals.
The chemicals used for conducting competitive enzyme linked immuno-sorbent assay (ELISA) in this study were of analytical grade.
A microtiter plate-based competitive ELISA was used for the analysis of AFM1 in dairy samples. The AFM1 ELISA kit was procured from R-Biopharm Netherlands BV (Arnhem, Netherlands; Catalog No. 5121AFM). The limit of detection (LOD) of the kit for milk was 0.005 μg/L and the cross- reactivity of the antibody for AFM1 and aflatoxin M2 was 100% and <20%, respectively.
The ELISA kit contained a sealed microtiter plate (96 wells) pre-coated with antibodies against AFM1, sample dilution buffer (40 mL), rinsing buffer (30 mL, 20× concentrated), conjugate solution (150 μL, 100× concentrated), dilution buffer (15 mL), substrate solution (12 mL), stop solution (15 mL) and standard AFM1 solutions (0,6.25, 12.50, 25, 50, 100, 200, and 1,000 pg/mL).
The OD was taken at 450 nm wavelength from Bio-Rad Model 680 ELISA reader (Bio-Rad, Hercules, CA, USA). The OD and AFM1 concentration in milk samples had an inverse proportion relationship. A total of 620 BTM samples were analyzed for AFM1 using ELISA.
The technique c-ELISA was executed as per the protocol standardized by the manufacturer. The test kit uses a microtiter plate of 96 wells with precoated antibodies against AFM1.
The AFM1 ELISA kit contains of one precoated microtiter plate. AFM1 standards and samples are filled into the wells. Free AFM1 from standard solutions and samples binds to specific binding sites of antibodies pre-coated on the plate. After incubation for one hour, the wells are washed, and horseradish peroxidase labelled AFM1 is poured to the wells. After an incubation of half an hour, the non-bound conjugate is washed away. The amount of bound AFM1–HRP conjugate is seen by adding substrate/chromogen solution (H2O2/TMB). The conjugate bound to the plate changes the colourless chromogen entity into the coloured product. The substrate reaction is paused with the combination of a stop solution (sulfuric acid). The OD is taken at 450 nm wavelength.
The pooled milk samples kept at –20°C were brought at room temperature using a water bath, and then these samples were processed in the refrigerated centrifuge at 2,000×g for 10 min at 4°C. Fat layer formed at the top was removed with the help of a spatula, and 100 μL of defatted samples were taken for ELISA analysis.
The samples were analysed for ELISA testing as per the kit manual, as follows:
100 μL of each of the AFM1 standard solutions were pipetted (i.e., 0, 6.25, 12.5, 25, 50, 100, and 200 pg/mL) in duplicate into the wells of a microtiter plate.
↓
100 μL of each sample solution (defatted milk) were pipetted into the remaining microtiter plate wells.
↓
Microtiter plate were sealed with aluminum foil and shake the container for five seconds.
↓
Microtiter plate were incubated for an hour in the dark at room at temperature (20°C to 25°C).
↓
Microtiter plate were washed three times with 300 μL rinsing buffer per well and dry on a paper tower.
↓
100 μL of conjugate (AFM1–HRP) pipetted to all the wells, except wells H1 and H2.
↓
Microtiter plate were sealed with aluminum foil and shake the container for five seconds 130.
↓
Microtiter plate were incubated for 30 minutes in the dark at room temperature (20°C to 25°C).
↓
The solution from the microtiter plate were discarded and wash three times with 300 μL rinsing buffer per. well and dry on a paper towel.
↓
100 μL of substrate solution (TMB) were pipetted into each well.
↓
The plate were sealed and incubated for half an hour at room temperature (20°C to 25°C) in dark.
↓
100 μL of stop solution were added to each well.
↓
Absorbance values immediately at 450 nm.
The mean OD of the microtiter plate wells H1 and H2 was subtracted from the individual OD of the wells, which contained the AFM1 standards and the samples. A standard calibration curve is plotted between the % maximal absorbance of the standard solutions on the Y-axis and the respective concentration (pg/mL) on a logarithmic X-axis. The maximal percentage absorbance was calculated with the following formula:
The agglomeration of AFM1 in bulk tank milk samples was calculated with the help of a regression equation derived from the calibration curve.
All the data analysis were performed with the help of MS Excel and SPSS (21.0) for windows. Descriptive statistics such as the number and frequencies of samples positive for AFM1, mean, lowest and highest values and SE of AFM1 levels were calculated according to the sample type and permissible limits. Further analysis of variance with post hoc Duncan’s test at 95% mean confidence interval was performed to analyze the data obtained.
A structured questionnaire of close-end questions was prepared to study the relationship between various risk parameters on the excretion of AFM1 in milk using reference to previous studies (Malissiova et al., 2013; Michlig et al., 2016; Patyal et al., 2020; Thukral, 2020).
A face-to-face interview was conducted, and questions were asked of dairy farmers. Questions related to animal-related and feed-related characteristics were asked, and information was recorded.
For the assessment of risk parameters associated with AFM1 in milk, the odds ratio (OR) was calculated based on the questionnaire prepared. Various risk factors were considered related to animal and feed characteristics. Considering the defined factors, a two-by-two frequency table was prepared. The following formula was used to determine the degree of association between the risk factors and AFM1 contamination.
Formula:
OR=1 Risk parameter does not affect the odds of the outcome
OR>1 Risk parameter associated with higher odds of the outcome
OR<1 Risk parameter associated with lower odds of the outcome
Results and Discussion
The bulk milk tank samples (620) of cattle and buffalo collected from the dairy farms of four regions were evaluated using a competitive ELISA for the detection and quantification of AFM1. The assessment of associated risk parameters with the AFM1 concentration in raw milk was also statistically analyzed. AFM1 is one metabolite of aflatoxin excreted in milk and therefore, human exposure can happen via the consumption of contaminated milk. Aflatoxins are well-established carcinogenic, hepatotoxic, genotoxic, immuno-modulating, teratogenic and mutagenic compounds in human beings. Therefore, considering the facts, the study was designed to estimate the occurrence and concentration of AFM1 in pooled milk samples.
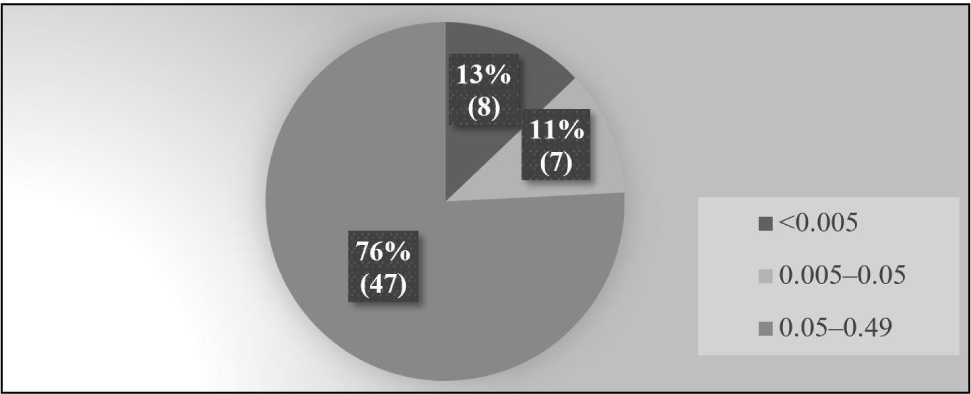
The pooled milk samples were considered positive when the concentration of AFM1 was detected higher than the LOD of the ELISA kit used (0.005 μg/L). Among the positive samples, the milk samples having AFM1 concentration above 0.05 μg/L were categorized as incompliant with regard to European Commission maximum permissible limit (EC-MPL) of AFM1 in milk. The milk samples where the AFM1 concentration was detected higher than 0.5 μg/L were categorized as incompliant with regard to Food Safety Standards Authority of India MPL (FSSAI-MPL) (Chen et al., 2023). The 87% of samples were positive i.e., having AFM1 concentration higher than the detection limit of the commercial ELISA kit used while 75.8% of pooled milk samples were having AFM1 concentration above the EC-MPL i.e., 0.05 μg/L. As per the FSSAI-MPL, none of the samples was found above 0.5 μg/L. The average level of AFM1 in positive samples was 0.142 μg/L. The minimum concentration was 0.0051 μg/L whereas the maximum level of AFM1 was 0.428 μg/L. 76% of the milk samples were having AFM1 level within a range of 0.05–0.49 μg/L. 11% of milk samples were within the range of 0.005–0.05 μg/L whereas 13% of milk samples were having AFM1 concentrations below 0.005 μg/L (Fig. 1). Factors such as local environment conditions, poor storage conditions of animal feed and inadequate ventilation of the feed storage room, which are ideal for the development of aflatoxigenic fungi, could also be accountable for the appearance of AFM1 in milk (Asi et al., 2012; Nile et al., 2016). The levels of AFM1 discovered in our study’s raw milk samples were found to be 208 greater than the levels seen (Nakajima et al., 2003), with a 0.001–0.029 μg/L range and a mean AFM1 concentration of 0.009 μg/L, Rastogi et al. (2004) who reported AFM1 contamination within range of 0.028–0.164 μg/L, Picinin et al. (2013) who observed mean emergence of 0.0195 μg/L with 0.0002–0.1057 μg/L range. The range and mean of AFM1 emergence in our study were found below the levels observed by Siddappa et al. (2012), who observed 0.1–3.8 μg/L of AFM1 levels in milk, Kanungo and Bhand (2014), who reported AFM1 levels within 0.511–0.809 μg/L, Kos et al. (2014) observed levels within 0.01–1.2 μg/L, Asghar et al. (2018) said AFM1 levels of 0.020–3.09 μg/L, Patyal et al. (2020) who reported 0.007–13.1 μg/L with the mean agglomeration of 0.917 μg/L and Kaur et al. (2021) who observed the AFM1 levels within of 0.005–1.735 μg/L with the mean emergence value of 0.314±0.35 μg/L.
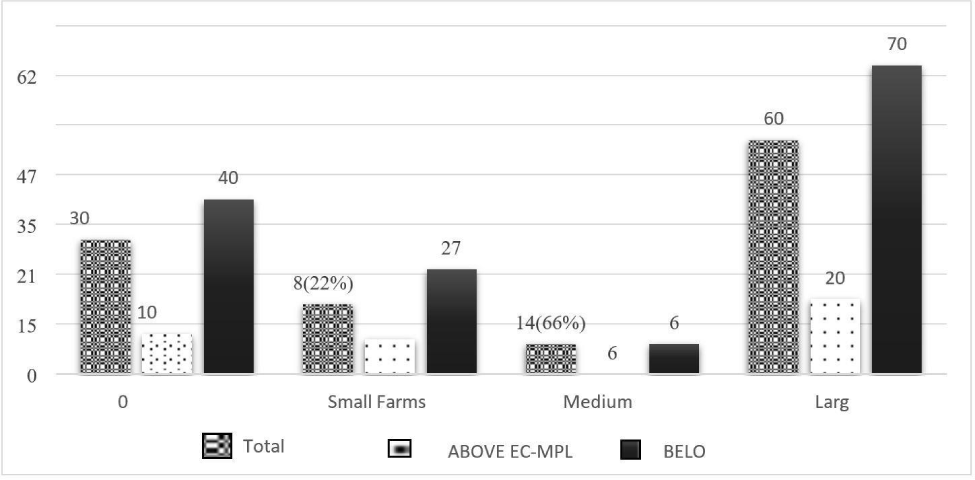
The prevalence of AFM1 in pooled milk samples obtained from large farms was 100% with an average concentration of 0.206 μg/L, whereas the majority of AFM1 was 77% and 66% in small and medium dairy farms, respectively with respect to EC-MPL. The mean concentration of AFM1 in pooled milk samples was 0.125 μg/L and 0.149 μg/L from small and medium dairy farms, respectively (Fig. 2). The results of the current study could be due to intensive feeding practices in large dairy farms, which is reported as one of the possible risk factors for high AFM1 occurrence in milk (Michlig et al., 2016). These large commercial farms have the majority of milking bovines with milk yield above the average milk yield per day, which could lead to higher AFM1 contamination in milk compared to small and medium dairy farms. Large dairy farms focus on increased milk production. To fulfil that, they introduce high-energy concentrated feeds in the animal’s ration. These full feeds are prone to AFB1 contamination, which is appeared in milk as AFM1 (Nile et al., 2016).
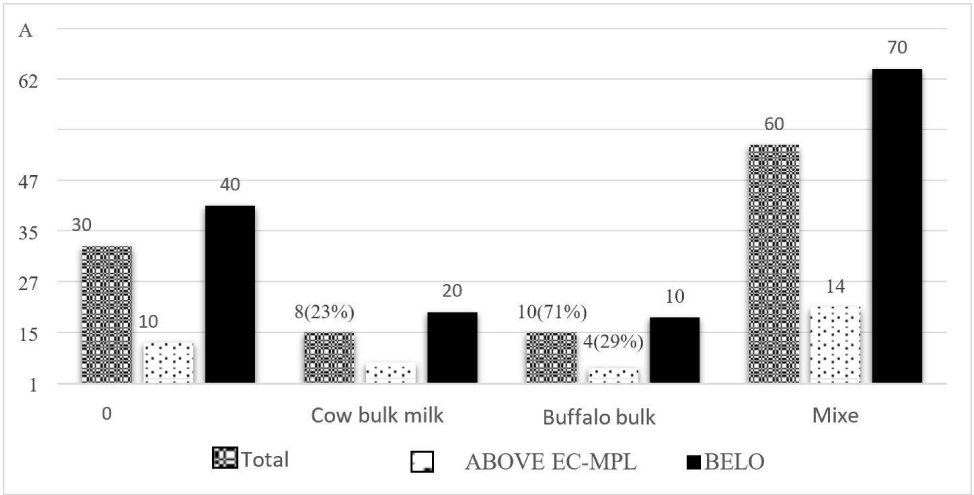
The prevalence of AFM1 in both species was compared concerning EC-MPL (0.05 μg/L). The majority of AFM1 contamination was slightly above in cow milk samples (77%) compared to buffalo milk samples (71%). The mean concentration of AFM1 detected in cow milk samples was 0.138 μg/L, less than that in buffalo milk samples (0.175 μg/L). In mixed milk samples (both cow and buffalo), the prevalence of AFM1 was similar to that of cow, and the mean agglomeration of AFM1 in composite milk samples was 0.126 μg/L (Fig. 3). The prevalence of AFM1 in the milk of cow and buffalo species in our study was found in harmony with the earlier studies by Nile et al. (2016), who reported a high prevalence of AFM1 in cow samples. Still, the average appearance of AFM1 was greater in buffalo than in the cow. However, this study’s findings differed from the earlier reported studies of Hedpara et al. (2022). They observed a higher presence of AFM1 occurrence in buffalo samples than in cattle. The higher mean level of AFM1 in the buffalo milk samples could be due to the greater feed intake in buffalo than in cows which results in higher ingestion of aflatoxin per gram of feed in buffalo, and a high concentration of AFM1 is emerged in milk.
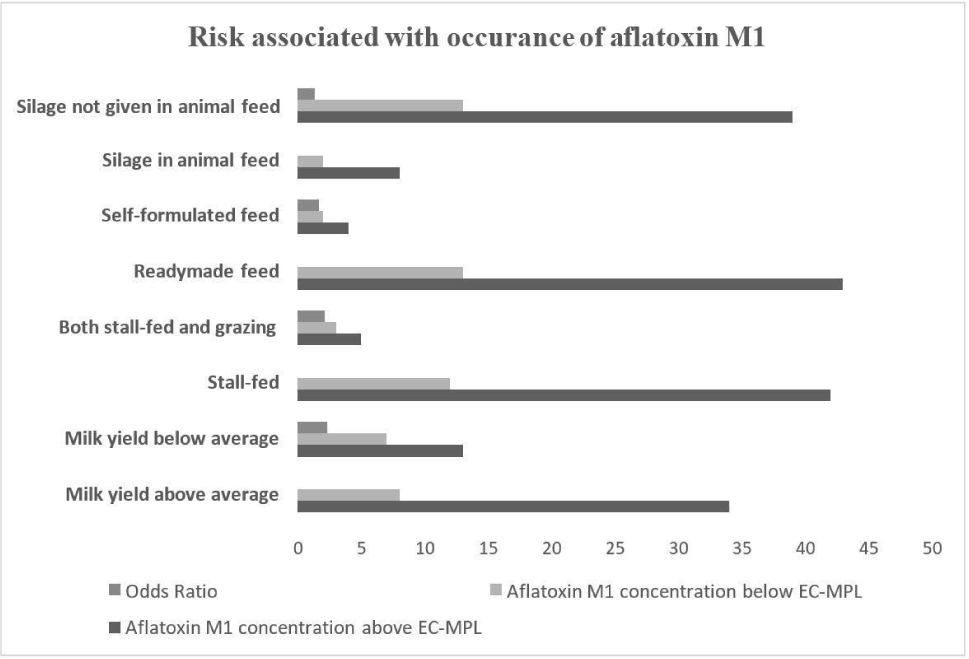
The analysis of risk factors linked with the AFM1 appearance in milk has been analyzed of animal-related parameters (total no. of animals, milk yield of dairy animals, etc.) and feed-related parameters (silage feeding, concentrate feeding, cleaning of feed storage space, etc.) following a 2×2 cross-classification table was drawn for each risk factor against the contamination extent of AFM1 in milk above EC-MPL. The OR was calculated to measure the linkage of risk factors with AFM1 contamination in milk. The regulation limit of the European Commission for AFM1 in milk (0.05 μg/L) was assumed as break- off value for the analysis.
In the milk yield sub-category, 81% of milk samples were reported with AFM1 concentration greater than the EC-MPL level and 19% of milk samples were below the EC-MPL level.
The dairy farms with animals with milk yields above the average milk yield per day were found to have 2.29 higher odds of AFM1 contamination higher the EC-MPL than those with below-average milk yield per day (Fig. 4). The studies found the findings congruent with British et al. (2013).
They observed that milk yield had a significant effect in contributing to the excretion of AFM1 in milk and observed that the high milk-yielding bovines are linked with the higher contamination levels of AFM1 in their milk. However, in a previous study by Van der Fels-Klerx and Camenzuli (2016), milk yield was found to have a minimum effect on AFM1 agglomeration levels in milk due to the potential dilution effect in high milk-yielding animals. The milk yield also depends upon intensive farming practices and highly concentrated feeds to animals which are possible risk factors for AFM1 contamination in milk in past studies (Michlig et al., 2016). The somatic cell count, which depends on the integrity of the plasma udder permeability, also had a role in the carry-over of AFB1 into AFM1 in milk but only during the early stage of the increase of AFM1 plateau Asi et al. (2012).
The dairy farms were divided into two sub-categories under the feeding system, mainly stall-fed feeding (intensive farming) and both stall-fed and grazing feeding (semi-intensive). In dairy farms where stall feeding was adopted, 78% of samples were found to be AFM1contaminated above the EC-MPL level, and 22% of samples were below the EC-MPL level. The dairy farms where stall feeding was adopted had twice times higher chances for AFM1 concentration above the EC-MPL level than dairy farms where both stall feeding and grazing were adopted (Fig. 4). The outcomes of our study were in agreement with the previous studies by Michlig et al. (2016) and Thukral (2020), who also concluded a high prevalence of AFM1 in farms where the intensive type of farming was observed. The high majority of AFM1 could be due to free stall feeding in the intensive type of farms (Asi et al., 2012) where concentrated feeds composed of marketed feed, corn, cottonseed, etc. may be given which are reported risk factors. Furthermore, the duration for which the concentrated feed is stored in dairy farms and the conditions at which it is stored are also observed as risk factors for the contamination of AFM1 in our study and a previous study (Patyal et al., 2020).
Under the source of feed category, dairy farms were divided into two groups readymade feed used as animal feed (readymade market feed) and self-formulated feed (the feed ingredients either grown or acquired from local markets and then mixed). About 77% of milk samples (readymade feed sub-category) were having AFM1 concentration above the EC-MPL and 23% of samples were below the EC-MPL. The dairy farms where the readymade feed was given to animals were found to have 1.65 higher odds of having AFM1 contamination in milk above the EC-MPL than the farms with self-formulated feed (Fig. 5). The observations of our study were found in alignment with the earlier research studies (Michlig et al., 2016; Patyal et al., 2020; Thukral, 2020) which reported a higher prevalence of AFM1 levels with respect to EC-MPL in farms where readymade feed was used. The appearance of AFM1 in milk from the farms where readymade feeds are given to animals could be due to the storage of readymade feed whereas self-formulated feed is mixed and given freshly to animals so the chances of growth of aflatoxigenic fungi are less but the ingredients could be susceptible to the fungi. The readymade market feeds could be contaminated with aflatoxins as these feeds are susceptible to aflatoxigenic fungi which are reported in previous studies throughout the country (Patyal et al., 2020). Also, the practice of buying feed having aflatoxin binders is not prevalent in dairy farms in the study area which could significantly decrease the AFM1 presence in milk as concluded in past studies (Aslam et al., 2015; Ullah et al., 2016).
In the silage feeding category, farms were divided into two sub-categories silage given in animal feed and silage not given in animal feed. 80% of milk samples were reported with AFM1 contamination above the EC-MPL (silage feeding), and 20% of milk samples were registered below the EC-MPL level. The dairy farms with silage feeding were found at 1.33 odds of having AFM1 concentration higher for EC-MPL than the farms where silage feeding was not practiced (Fig. 5). The outcomes of our study were found in harmony with the prior studies by Michlig et al. (2016) and Patyal et al. (2020). They observed almost the exact prevalence of AFM1 in samples under the silage risk factor category. However, the aflatoxigenic fungi and their mycotoxins have been isolated from the wheat silage for dairy cattle (del Palacio et al., 2016) and from maize and grass silage by González-Jartín et al. (2022). The hay produced from the grains with the least feasible moisture content ranging from 14% or less is less susceptible to AFB1 contamination, as (Chen et al., 2023) reported.
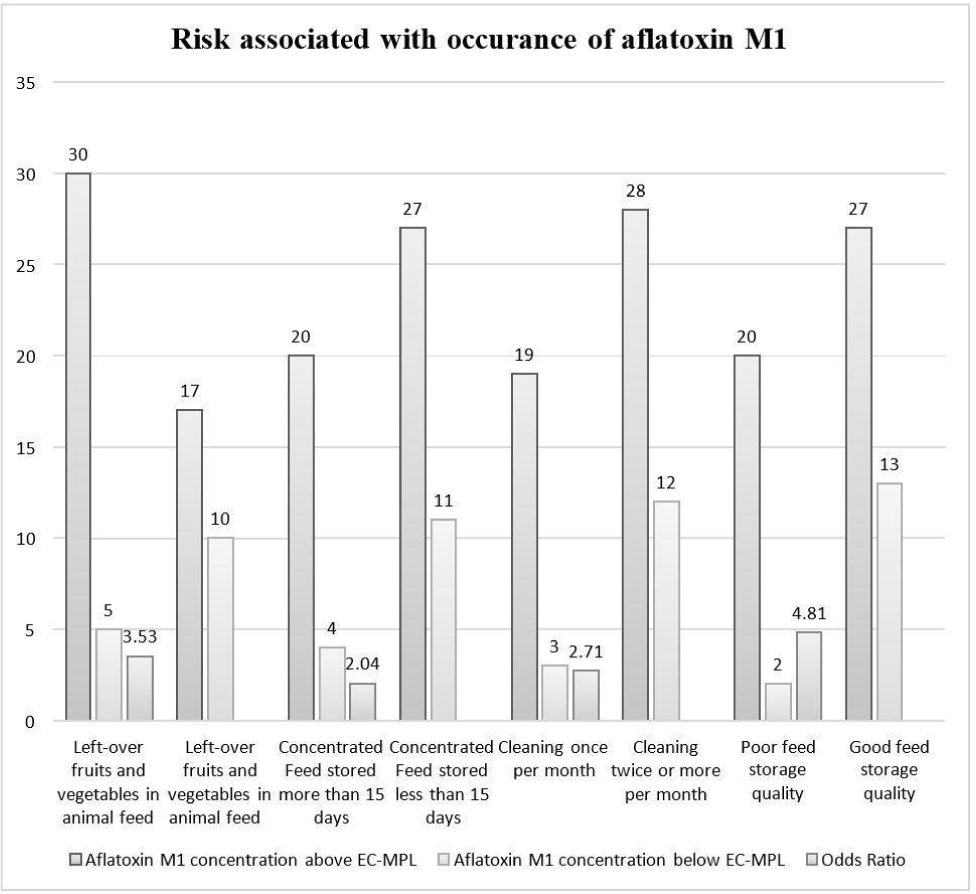
In left-over fruits and vegetables given in the animal feed sub-category, 86% of pooled milk samples were reported with AFM1 concentration above the EC-MPL, and 14% of pooled milk samples were below the EC-MPL level. The dairy farms where the feeding of left-over household fruits and vegetables was fed were found to have 3.53 higher odds of having AFM1 concentration above the EC-MPL than those where left-over fruits and vegetables were not provided to the animals (Fig. 5). The findings of our work were in line with the observations of a previous study by Patyal et al. (2020). They reported a high prevalence of AFM1 concerning EC-MPL in dairy farms where left-over fruits and vegetables were fed to animals. Due to their high moisture content, the leftover fruits and vegetables may act as a favourable environment for the growth of aflatoxigenic fungi, which, when fed by cows, may cause them to excrete AFM1 in their milk. AFM1 contamination has been reported in fruits like tomatoes, pumpkin, coriander, persimmon, peaches, and cucumber (Sahar et al., 2009).
In left-over household cereals given in the animal feed sub-category, 77% of milk samples contained AFM1 concentration greater the EC-MPL, and 23% of milk samples were below the EC-MPL level. The farms where left-over household cereals were fed to animals had 1.24 higher odds of AFM1 contamination in milk higher the EC-MPL than the farms where feeding left-over household cereals was not practiced (Fig. 5). The outcomes of this study were in harmony with the research findings by Patyal et al. (2020) reported a high frequency of AFM1 contamination in milk concerning EC-MPL in farms where left-over household cereals were fed to dairy animals.
The 15 days interval period was taken as this period is ideal for aflatoxigenic fungi to grow and produce toxins in focused feed. In farms where concentrated feed was stored for more than 15 days, 83% of milk samples were analysed with AFM1 concentration above the EC-MPL, and 17% of milk samples were reported below the EC-MPL level. The farms with longer feed storage duration were found to have 2.04 higher odds of AFM1 contamination level above EC-MPL than those with shorter feed storage duration (Fig. 5). Patyal et al. (2020), who reported a high prevalence of AFM1 above the EC-MPL from the farms which stored concentrated feed for more than 15 days. The high prevalence of aflatoxins could be due to poor conditions of the stored, focused feed (Kaur et al., 2021).
The cleaning practice of feed storage space was recorded, and the farms were divided into two sub-categories: farms where cleaning was carried out once per month and farms where cleaning was done twice or more than twice per month. In dairy farms where feed storage space was cleaned once per month, 86% of milk samples contained AFM1 concentration higher the EC-MPL, and 14% of milk samples were below the EC-MPL level. The dairy farms where cleaning was performed once per month were found to have 2.71 odds of AFM1 above EC-MPL than those where cleaning was practised twice or more per month (Fig. 5). This study’s findings were same to the result concluded by Patyal et al. (2020). They also wrote about a high prevalence of AFM1 contamination above EC-MPL in dairy farms where the feed storage space was cleaned once per month. Cleaning the feed storage space could lower the presence of aflatoxigenic fungi in feed and may lower the AFM1 level in milk as sanitation reduce the microbial load and result in hygienic premises, which helps prevent other diseases (Chen et al., 2023).
The feed storage space was also visited during the collection of milk samples. Depending upon the conditions, like temperature, humidity, ventilation, etc., of the feed storage room, the dairy farms were divided into two categories: good feed storage quality and poor feed storage quality. The excellent feed storage quality had better feed storage practices than the poor feed storage quality. Asi et al. (2012) and Nile et al. (2016) reported that the conditions like high humidity, lack of ventilation, etc., favour the development of aflatoxin-producing fungi in animal feed. When the bovines consume this feed, AFM1 is excreted in their milk. In the poor feed storage quality sub-category, 67% of milk samples were reported with AFM1 contamination above the EC-MPL and 33% of milk samples were reported with AFM1 contamination below the EC-MPL.
The dairy farms with poor feed storage quality had 4.81 odds of having higher contamination of AFM1 than those with good feed storage quality (Fig. 5). The observations in the current study for the feed storage conditions concur with an earlier analysis by Patyal et al. (2020). They observed a higher prevalence of AFM1 above the EC-MPL in farms with poor feed storage quality. The frequency of AFM1 in milk could be result of the improper storage condition of the feed, which is also reported as a risk factor by an earlier study by Akbar et al. (2020). Lower contamination of AFM1 in milk could be attained by reducing the AFB1 in animal feed by adopting good manufacturing practices and good feed storage practices, as reported by Nile et al. (2016).
Conclusion
Three fourth of the raw milk sample was found greater the maximum permissible level as per European standards, however, as per Indian standards, none of sample was found higher the maximum permissible level. The larger farms, high milk yielders, and intensive farming were found at greater risk for the occurrence of AFM1 levels. The feed storage and cleanliness status were also found to be determinants of AFM1 occurrence risk analysis. The risk associated with AFM1 contamination was of large farms (100%), higher milk yield (81%; OR of 2.29), intensive farming (78%; OR of 2.1), left-over household fruits and vegetables incorporated in animal feed (86%; OR of 3.53), cleanliness status at the farm (86%; OR of 2.71) and feed storage status (91%; OR of 4.81) to be at higher risk. The AFM1 level in raw milk was found in the range of 0.116 μg/L to 0.196 μg/L.