
Introduction
Small substances with at least one dimension between one and one hundred nanometers are known as nanoparticles (NPs). Due to their tiny size and large surface area, nanoparticles play a key role in all aspects of modern life (Zayed and Luaibi, 2018). By shrinking matter to a scale of 1 to 100 nm, nanotechnology is a significant area of innovation in the industry (Minetto et al., 2016). The food sector, drug delivery, diagnosis, cosmetics, and several sunscreens are just a few industries where nanoparticles (NPs) are used (Al-Suhaibani and El-Morshedi, 2014). ZnO nanoparticles are exposed to the human body more and more as their use increases. Inhalation, cutaneous contact, and ingestion are the three main ways that ZnO nanoparticles are exposed to the body (Iavicoli et al., 2017). ZnO nanoparticles can enter the circulatory system through a variety of routes after exposure, and through it, they can spread throughout the entire body (Yeh et al., 2012). When ZnO nanoparticles enter the body, they are of a nanosize that quickly allows them to penetrate cells, where they are internalized as either free Zn2+ ions or nanoparticles by the cells (Liu et al., 2017).
Micronuclei have been scored extensively to discover potential genotoxic substances since they are good indicators of genotoxic exposure in both humans and animals (Terradas et al., 2010). A crucial in vivo cytogenetic screening method for identifying newly produced structural chromosomal damage in bone marrow cells is the micronucleus test (Schmid, 1975). Chromosome abnormalities in rat bone marrow and the micronucleus test have both been used extensively to clarify the connection between food and mutagenesis. Micronuclei can be utilized as a mutation index because they are a sign of permanent DNA loss (McKelvey et al., 1993). At a dose of 2,000 mg/kg, Srivastav et al. (2016) found that Wistar rats had decreased red cell counts, liver lesions, and hepatocyte inflammation. According to Chupani et al. (2017), diet-borne ZnO NPs can modify the molecular structure and morphology of the blood, intestine, liver, and kidneys. These NPs may display unpredictable genotoxic features through direct interaction with genetic material or by indirect DNA damage brought on by reactive oxygen species due to their tiny size and increased surface area combined with physiochemical properties like charged surfaces (Kisin et al., 2007). Chromosome abnormalities in rat bone marrow and the micronucleus test have both been used extensively to clarify the connection between food and mutagenesis. Micronuclei can be utilized as a mutation index because they are a sign of permanent DNA loss (McKelvey et al., 1993). Evaluation of nanoparticle toxicity is necessary in order to understand the genotoxic potential of ZnO NPs in an animal model due to the rapid development of nanotechnology and rising exposure to nanoparticles. The current study was carried out to investigate the acute oral toxicity of ZnO-NPs at doses 100, 200, 300, 400, and 600 mg/kg. Hematology assays and the genototoxic effects of ZnO NPs using micronucleus and comet assay.
Materials and Methods
Zinc oxide nanoparticles (ZnO-NPs) were obtained from NanoTech Company, Egypt. According to the information provided by manufacturer the particles size of ZnO nanoparticles is 30±5 nm. Chemicals used for the quantitative determination of various biochemical and hematological parameters were purchased from Bio Diagnostic company and Human company (Egypt).
The ZnO NPs participles (30±5 nm) were dispersed in distilled water (10 mg/mL) and the suspension was sonicated at 230 V for 20 minutes using ultrasonic cleaner sonicator (Branson ultrasonic, Danbury, CT, USA) at room temperature. The suspension was stirred on vortex agitator immediately before administration in different dosages (100, 200, 300, 400, and 600 mg/kg).
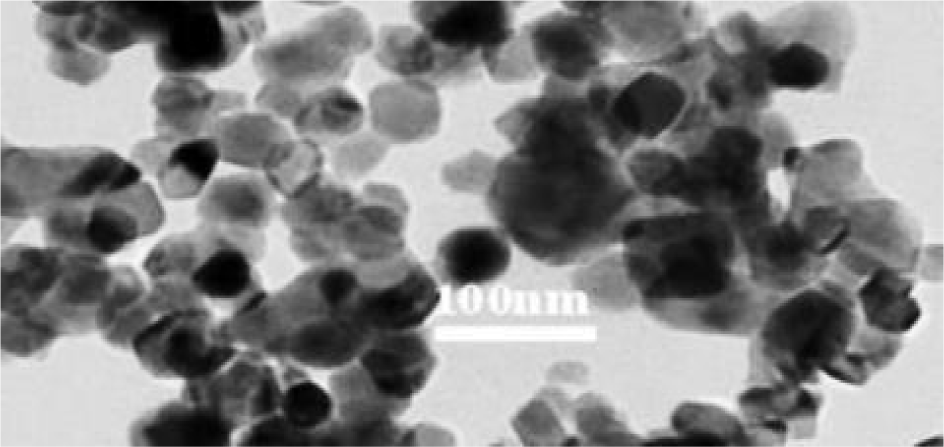
After vigorous sonication, the solution distribution of the nanoparticles was dropped onto a copper grid that had been coated with carbon to examine the diameter and shapes of the particles. The grid was then observed using a JEOL JEM 1010 Transmission Electron Microscope after being air - dried at room temperature. Using a transmission electron microscope (TEM) with a 200 kV accelerating voltage, the morphological structure of zinc oxide nanoparticles (ZnO-NPs) was analyzed. The crystal structures measured 30±5 nm and closely resemble a sphere (Fig. 1).
Thirty male Sprague-Dawley rats, 8–10 weeks old and weighing 140–160 g, were purchased from Rapitco Farm Company in Giza, Egypt. Five animals per cage were kept in standard plastic cages under controlled environmental conditions at a temperature of 25±2°C with 12-hour cycles of light and darkness.
Six groups of thirty rats were created after the adaptation phase (Five rats per group). Rats in Group 1 (G1), which was designated as the control group, consumed a regular synthetic meal and had unlimited access to water, while those in the other five groups received oral gavage administration of zinc oxide nanoparticles at varying concentrations during a 10-week period. The rats in group 2 (G2) were received 100 mg/kg ZnO NPs suspension orally once daily, Group 3 (G3) 200 mg/kg ZnO-NPs suspension orally once daily, Group 4 (G4) 300 mg/kg ZnONPs suspension orally once daily, Group 5 (G5) 400 mg/kg ZnONPs suspension orally once daily, and Group 6 (G6) 600 mg/kg ZnONPs suspension orally once daily.
For the hematological study, blood samples were taken from the retinal vein of each rat in each group. A Clindiag Hematology Analyzer (HA-22/Vet, Ninove, Belgium) was used to obtain a complete blood picture for each group. Red blood cell count (RBC), hematocrit (HCT), hemoglobin (Hb) concentration, and red cell indices were included in the analysis. Also included were mean corpuscular volume (MCV), mean corpuscular hemoglobin (MCH), mean corpuscular hemoglobin concentration (MCHC), white blood cell count (WBC), and their differential (lymphocytes, granulocytes, and monocytes), as well as platelet count (PLT).
According to the method published by Schmid (1975), the micronuclei (MN) test and the scoring of micronucleated polychromatic erythrocytes (MnPCEs) were performed. The ratio of polychromatic erythrocytes (PCEs) / normochromatic erythrocytes (NCEs) was calculated using a minimum of 2000 PCEs per animal (NCEs). To estimate the MnPCEs, the coded slides were examined under 100 oil immersions.
The single cell electrophoresis (comet assay) which developed by Singh et al. (1988) was used in cytogenetic assays. It was combined with the simplicity of biochemical methods for identifying DNA single strand breaks (frank strand breaks and incomplete excision repair sites), alkali-labile sites, and crosslinking in the single cell gel electrophoresis (SCGE). Comet assay was performed in Animal Reproduction Research Institute (ARRI), in Giza, Egypt.
Results and Discussion
The observation during this study showed that no serve toxicity signs such as diarrhea or hair loss. Furthermore, no mortality was observed related to different doses of ZnO-NPs administration (100, 200, 300, 400, and 600 mg/kg body weight). Also no behavioral changes were observed related to be orally administered to rats. This finding was agreed with the results of (Ben-Slama et al., 2015).
Table 1 displays the impact of various ZnO-NP concentrations on rat body weight gain throughout the duration of the entire experiment. The average rate of rat body weight gain significantly decreased when compared to the control group, according to the data (p<0.05). The findings of the present investigation regarding the decrees in the body weight gain were consistent with those of Hong et al. (2014), who found that rats given ZnO NPs by gavage at doses of 0, 100, 200, and 400 mg/kg/day saw a drop in body weight due to a decrease in food intake. It was reported that a high dose of ZnO NPs in the diet could have toxicological effects, but Wang et al. (2016) showed that 50 and 500 mg/kg nano-ZnOs demonstrated increases in body weight while at 5,000 mg/kg showed decreases in body weight. This suggests that the decrease in body weight at 5,000 mg/kg ZnO NPs may help explain the increase in the relative weights of the pancreas, brain, and lung. Decrease of body weight may be attributed to anabolic metabolism in body of treated animals, or as a result of antidigestion effect, or due to the loose of appetite in treated animals as a result of nanoparticles administration (Shirvani et al., 2014).
According to the findings showed in Table 2, treated rats' hemoglobin content and PLT did not differ significantly from the control groups (p<0.05). The findings showed that all rat groups that received ZnO NPs during the experiment experienced significantly lower hematocrit percentages and RBCs than the control group. However, after 10 weeks, the treatment groups' rats had significantly higher levels of WBCs, MCV values, MCH, and MCHC than the control groups' rats. Hematological studies showed that ZnO-NPs can penetrate and translocate within living creatures, which is important for assessing the toxicity of ZnO-NPs (Yang et al., 2016).
The abbreviations RBC, WBC, MCV, MCH, and MCHC stand for red blood cells, white blood cells, and mean corpuscular volume, hemoglobin, and concentration, respectively. Data are the means and standard errors of five animals per group. At p<0.05, the difference between mean values with different superscripts in the same row is statistically significant.
According to research by Dhawan and Sharma (2010), when given orally and exposed acutely, NPs of various materials are more hazardous than their microparticle counterparts. According to Sano et al. (2006), a significant decline in lymphocyte percentage, WBC, and MCHC may be the result of blood leakage from vessel walls brought on by high dosages of ZnO-NPs. According to Ben-Slama et al. (2015), platelet levels decreased, which is consistent with our findings. They did, however, demonstrate an increase in RBC, which is in contradiction to our findings. According to research by Wang et al. (2008), an increase in the number of red blood cells may cause a rise in blood viscosity. Additionally, in line with our research, Somayeh and Mohammad (2014) found that the toxicity of zinc oxide nanoparticles causes an increase in white cell count. According to Liu et al. (2015) zinc oxide nanoparticles can lead to increase in white and RBC, a decrease in lymphocyte count, and an increase in neutrophil count. By utilizing the same doses and routes administration of ZnO NPs but with various administration times up to 21 days, Espanani et al. (2015) demonstrated in this period a decrease in the counts of platelet and lymphocyte with an increase in white cell count and no effect on the red cell count. Depending on the administered dose, sub-chronic use of zinc oxide nanoparticles was reported to cause toxic symptoms in the lymphatic system and in the blood cell count (Elshama et al., 2017).
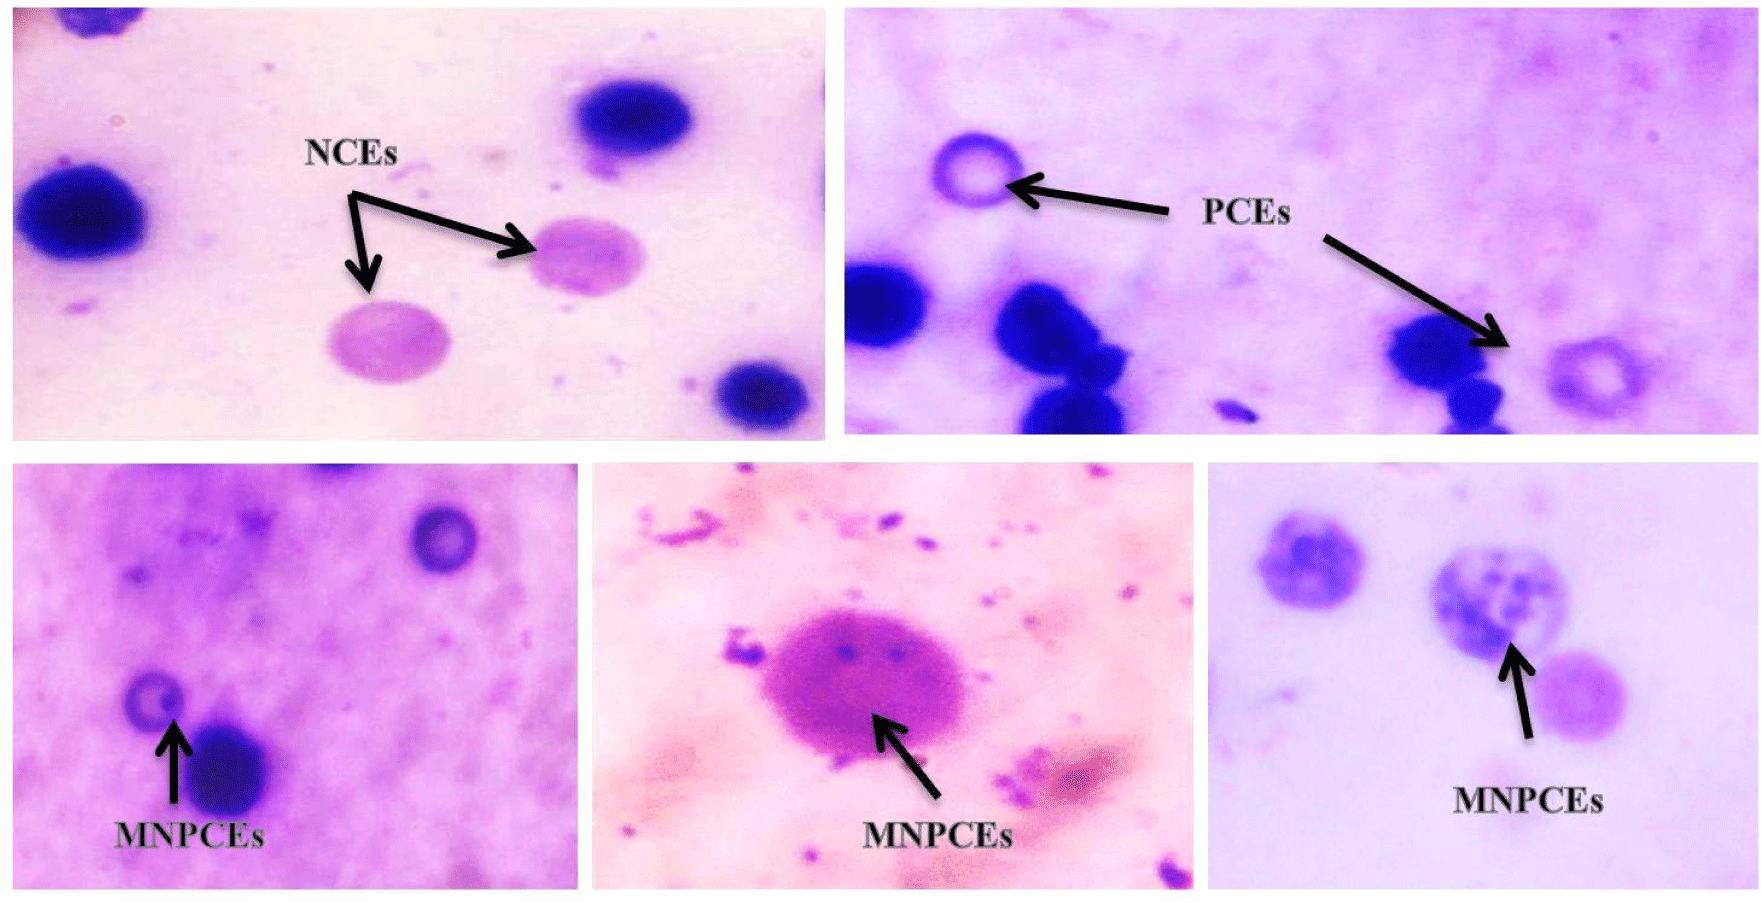
Table 3 displays the mean of the micronuclei frequency after treatment with various concentrations of ZnO NPs and the corresponding controls. The PCEs were painted a light blue to grey colour, whereas the NCEs were painted a light pink to light yellow colour (Fig. 2). The results demonstrate that as the dose of ZnO NPs was increased, the frequencies of micronucleated erythrocytes in the bone marrow of treated rats increase as well. By increasing the dose of ZnO NPs, the percentage of PCEs/NCEs was decreased. According to the findings obtained, 10 weeks of administration with 600 mg/kg body weight ZnO-NPs triggered the greatest increase in bone marrow cytotoxicity (PCE / NCE ratio). Extranuclear entities known as micronuclei (MN) are made up of broken-down chromosomal fragments and/or complete chromosomes that were not absorbed into the nucleus after cell division. A buildup of DNA damage, chromosomal abnormalities, and deficiencies in the cell repair mechanism can cause MN (Fenech et al., 2011). Tripathi et al. (2012) evaluated the correlation between the numbers of immature erythrocytes (PCEs) and the mature erythrocytes (NCEs), and they discovered that when the normal bone marrow cell proliferation is hampered by any toxic agent, a decline in the PCE/NCE ratio could be seen.
| Groups | Doses (mg/kg) | No. of PCEs | Mn/PCEs% | PCEs/NCEs% |
|---|---|---|---|---|
| G1 | 0 | 2,000 | 0.15 | 17.99 |
| G2 | 100 | 2,000 | 0.25 | 12.11 |
| G3 | 200 | 2,000 | 0.45 | 12.38 |
| G4 | 300 | 2,000 | 0.5 | 11.88 |
| G5 | 400 | 2,000 | 0.6 | 11.38 |
| G6 | 600 | 2,000 | 0.8 | 11.70 |
According to Suzuki et al. (1989), PCE counts in peripheral blood were the most widely used and practical way to monitor erythropoiesis. They also noted that examination of erythropoietic cytotoxicity was a significant component of safety assessment in novel drug development. Fewer immature erythrocytes (PCE) than mature or NCE were thought to be a marker of cytotoxicity caused by mutagens (Kirsch-Volders et al., 2003). Some micronucleus test guidelines advise using the P/N ratio to estimate a compound's toxicity to bone marrow cells. It has been demonstrated that the P/N ratio changes when stronger pharmacologic doses are given or when bone marrow cells are extracted at later sampling intervals (Heddle et al., 1984). A decline in the P/N ratio could be brought on by either a decline in PCE, an increase in NCE, or imbalanced alterations in the populations of both cell types.
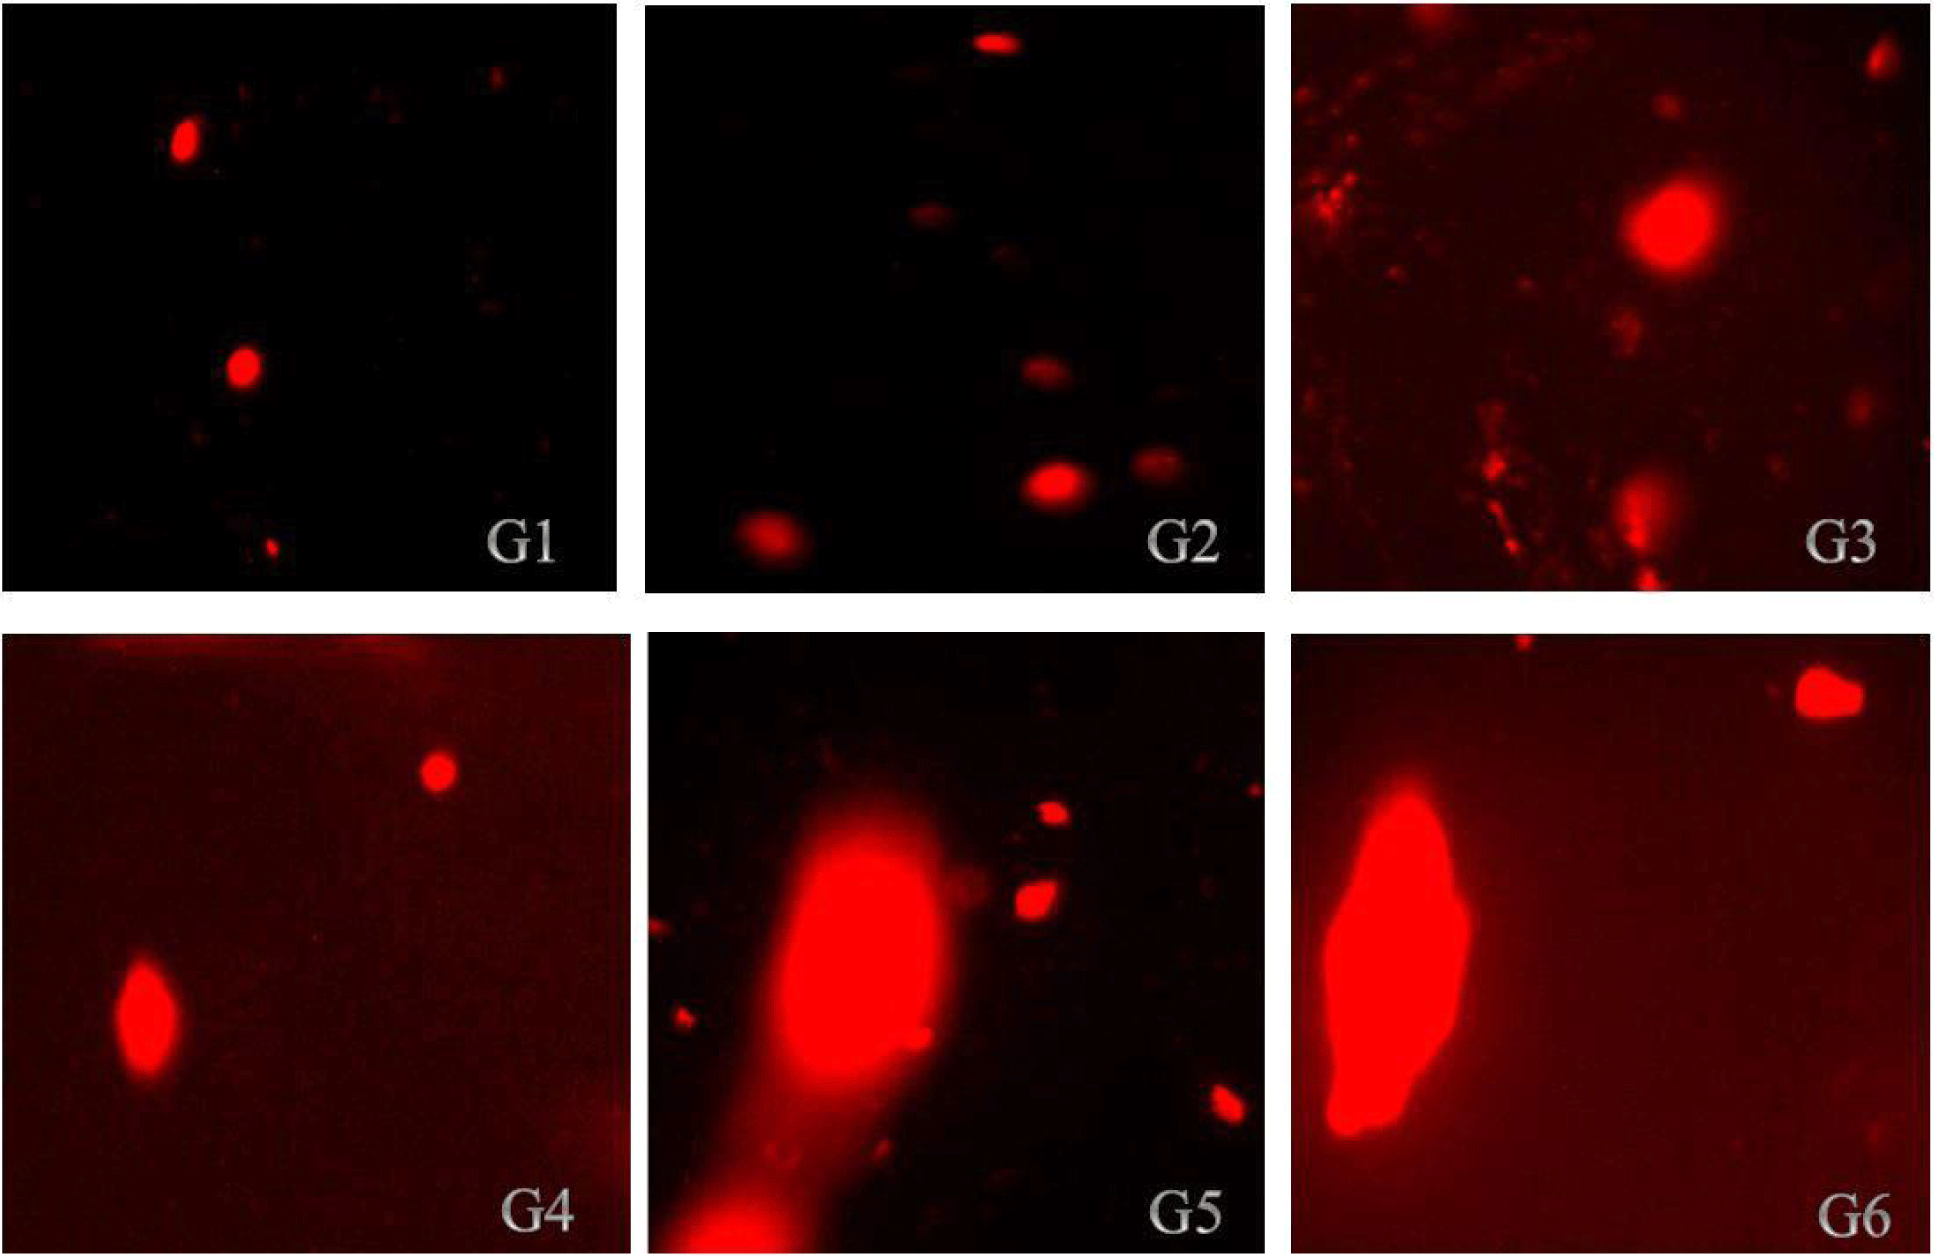
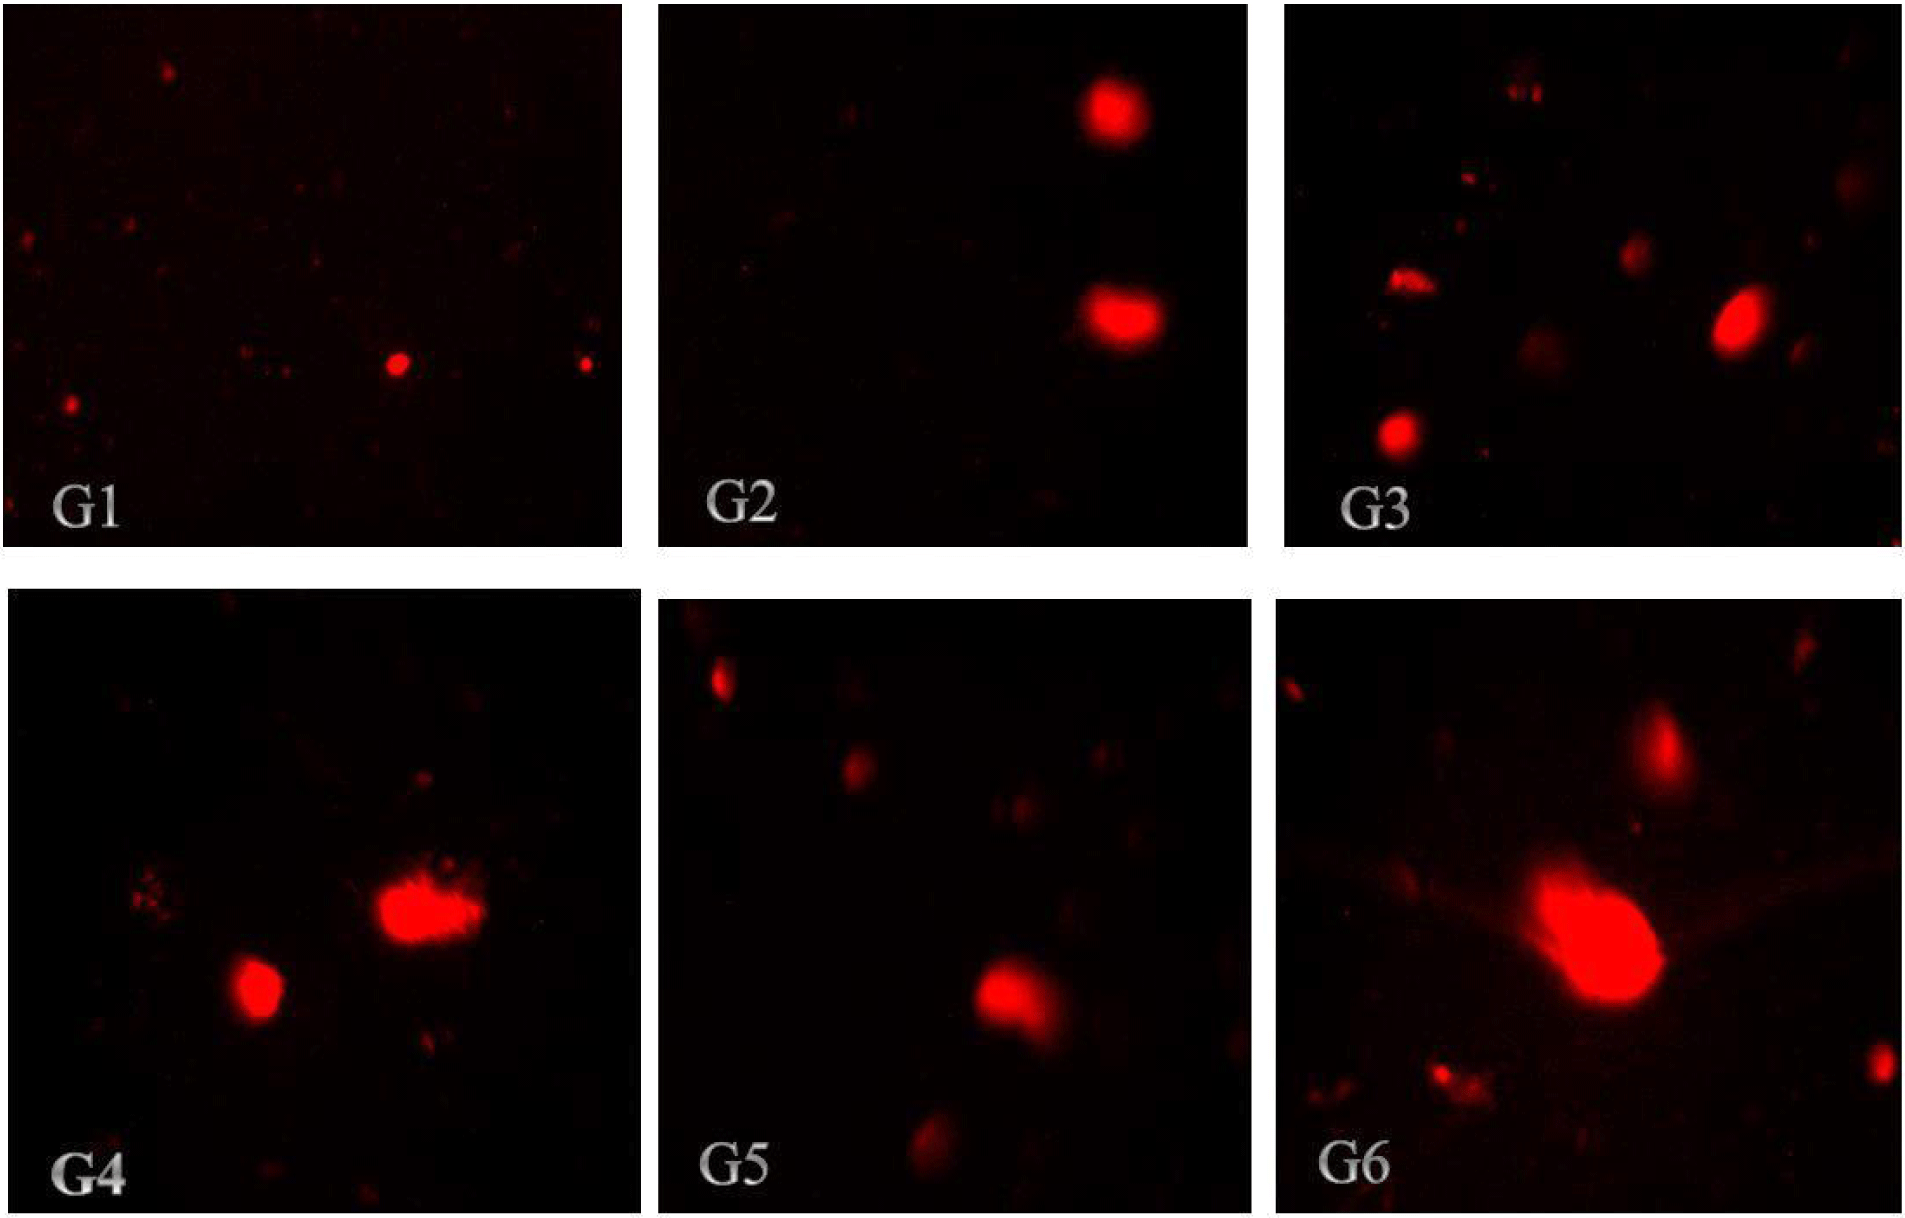
The findings in Tables 4 and 5 demonstrated that ZnO-NPs increased the tail length, tail intensity, tail migration, and tail moments in the kidneys and liver, respectively. According to the results in Table 4, all treatment groups of rats had their liver DNA's tail length increases as a result of the administration of nano-ZnOs; the tail lengths of the rats in group (G6) and control group (G1) were 10.57 μm and 4.94 μm, respectively. According to the results illustrated in Table 5, kidney cell tail length, DNA content, tail moment, and olive tail moment were all dose-dependently increased by ZnO-NP compared to control. These results reveal that genotoxicity was the cause of the DNA damage that was seen, and that the DNA damage caused by ZnO-NPs in the rat liver and kidneys might be detected using the comet assay. Photomicrographs of the DNA damage (comet assay) in rat liver and kidney cells were shown in Figs. 3 and 4, respectively. The single-cell gel electrophoresis assay, also referred to as the comet assay, is a technique for quantifying DNA strand breaks in eukaryotic cells (Tice et al., 2000). Based on the length of the genetic material's movement (tail length) in the anode-directed direction during the comet assay, the quantity of DNA breakage in a cell was calculated (Singh et al., 1988). Furthermore, it has been demonstrated that the frequency of DNA strand breaks is inversely correlated with the proportion of DNA in the tail (tail intensity) (Olive et al., 1990). The computerized image analysis system calculates the tail moment, a straightforward descriptor by taking into account both the migration tail length and the percentage of DNA that travelled in the tail (Villarini et al., 1998). DNA damage results from the lengthening of DNA tails at all ZnONP doses over the course of 70 days, as is seen from DNA fragmentation. This genotoxicity may be caused by ZnONPs' oxidative and nitrosative actions (Kumar and Dhawan, 2013; Sharma et al., 2012).
Conclusion
A conclusion that can be made from in vivo genotoxicity experiments is that ZnO NPs with particle sizes of 30 nm for ten weeks are capable of causing genotoxicity and cytotoxicity in rat bone marrow cells, liver, and kidney. The results of present study may increase the alarms about the probable risk on human health that might be related with plentiful applications of ZnO NPs.