Introduction
The argument that the livestock industry is a major contributor to the climate crisis stems from the Food and Agriculture Organization of the United Nations’ (FAO) 2006 report, “Livestock’s Long Shadow.” It stated that greenhouse gas (GHG) emissions from livestock supply chains accounts for 18% of the total emissions and this industry emits more GHGs than the world’s entire transportation system (Steinfeld, 2006). However, this is an unfair comparison. GHG emissions from the livestock industry comprises those produced during the course of the entire supply chain—from growing feed crops, manufacturing and transporting feed, raising livestock, transporting livestock, slaughtering, processing, and selling to disposal of feed. Meanwhile, GHG emissions from the transportation sector include those from all vehicles, such as cars, ships, planes, and trains (Kim and Na, 2008). To make a fair comparison, the GHG emissions of each mode of transport should include the sum of those produced during manufacturing, operation, and disposal, as well as production, processing, and distribution of petroleum as fuel.
In terms of direct emissions alone, transportation accounts for 16.9% and livestock accounts for 7%, while in Korea, transportation accounts for 13.5%, and livestock accounts for 1.3%. Global GHG emissions from the livestock industry are less than half of that of the transportation sector, and in Korea, GHG emissions from the livestock sector is only 1/10 of those from the transportation sector (Fig. 1) (Jo, 2021).

Nevertheless, in recent years, claims that the livestock industry is a major contributor of GHGs have gained momentum, leading to the perception that livestock production is one of the causes of the climate crisis. In fact, vegetarian meals are being introduced in Korean educational institutions, which are part of the public sector. Additionally, local and national governments are introducing various programs to encourage vegetarianism or replace livestock products with other foods (Jo, 2021).
Therefore, in this review, we investigated the actual situation regarding GHG emissions from the agricultural and livestock sectors to resolve the misunderstanding related to excessive GHG emissions from livestock production and provide data to encourage a joint effort by all industries to reduce emissions by formulating appropriate policies.
Status of greenhouse gas (GHG) emission in Korea
In 2010, the energy, industrial processes, and agriculture sectors accounted for 68.0%, 7.0%, and 11.0% of emission of the major GHG gases, namely carbon dioxide (CO2), methane (CH4), and nitrous oxide (N2O), respectively, and other sources accounted for 14.0% of the emissions [United Nations Intergovernmental Panel on Climate Change (IPCC), 2014; http://www.ipcc.eh]. According to the National Greenhouse Gas Inventory Report of the Korean Ministry of Environment, Korea’s total GHG emissions in 2018 were 727.6 million tons of CO2 equivalent, i.e., an increase of approximately 149% from 292.2 million tons in 1990. Nearly 87% (approximately 632 million tons) of the total emissions in 2018 were from the energy sector; nearly 7.8% (approximately 57 million tons), from industrial processes; nearly 2.9% (approximately 21 million tons), from agriculture; and nearly 2.3% (approximately 17 million tons), from waste (Kang, 2021). Although South Korea’s GHG emissions have been gradually increasing, the agricultural sector’s contribution to national GHG emissions decreased by more than 3% in 2017 when compared with that in 1990 owing to the continuous decline in rice cultivation since 1990, decline in livestock production after the foot-and-mouth disease outbreak in 2010, and GHG-absorbing ability of forests and grasslands (Kang, 2021). Total GHG and CO2 emissions decrease and increase in an N-shaped relationship depending on Korea’s economic growth, while CH4 and N2O emissions increase and decrease in an inverted U-shaped relationship. Additionally, the agricultural sector in Korea has different impacts depending on the source of GHG emissions. CH4 and N2O, in particular, rise with increased agricultural production in Korea, indicating the need for policy or technology development in this sector. In order to support the 2030 GHG Reduction Roadmap, promotion of GHG-reduction technologies or policies can help the country achieve the associated targets. However, expansion of GHG reduction policies that do consider agricultural production and food security at the national level can predict reduction in production in the agricultural sector and damage to related industries (Kang, 2021; Lee et al., 2019). Therefore, the introduction of detailed GHG reduction policies and technologies that consider the industrial characteristics of the agricultural sector and the relationships between GHG emission sources is necessary (Kang, 2021).
Greenhouse gas (GHG) emission in agriculture sector
The agricultural sector is both an emitter and absorber of GHGs (Kim and Lee, 2009). The consumption ratios of light and livestock sectors to the total energy consumption of the agricultural sector is 53.5% and 46.5%, respectively, and their ratios to the total energy consumption volume is 55.3% and 44.7%, respectively, with light consistently higher than that of the livestock sector (Kim and Lee, 2009). Considering domestic GHG emissions, the agricultural sector is regarded as both an emitter and absorber of GHGs. Hence, the economic impact of reducing GHGs in the agricultural sector can be expected to be quite large (Kim and Lee, 2009). The major GHGs generated in the agricultural sector are CO2, CH4, and N2O. According to data from the US Environmental Protection Agency, CO2 accounts for approximately 70% of GHG emissions. CH4 accounts for 23% of GHG emissions in the atmosphere, although its proportion is gradually increasing. While rice paddies constitute the largest portion of Korea’s agricultural area and are beneficial by contributing to flood control, climate moderation, and air purification (Ki et al., 2012), they are also a major source of GHG emissions (mainly, CH4). This is because organic materials, such as fertilizers and compost, injected during rice cultivation are decomposed by bacteria in oxygen-poor freshwater, producing CH4 gas. However, most people are not aware that GHGs are produced in rice fields. A report by the IPCC also pointed out that since the 20th century, rice farming has been a major contributor of CH4 emissions, and they need to be controlled (Kim and Na, 2008; Park, 2021). Moreover, Reiner Wassmann, a climate change expert at the International Rice Research Institute, highlighted the contribution of rice cultivation to the GHG emissions of Asian countries, and further stated that rice cultivation is not the main contributor, but must be given attention in efforts to reduce GHG emissions in Asian countries (Wassmann et al., 2019). While CO2 has a greater impact on global warming, CH4 is known to be 21 times more potent than CO2 as a GHG (Kim and Na, 2008; Park, 2021).
According to data from the Korean Ministry of Environment, light cropping and livestock farming are sources of GHGs in the agricultural sector (Government of the Republic of Korea, 2020). From 1990 to 2010, light cropping showed a decreasing trend and livestock farming, an increasing trend, which then stagnated. In 2017, the amount of light cropping and livestock farming emissions were 11.8 million tons CO2 equivalent and 8.6 million tons CO2 equivalent, respectively (Table 1) (Jang and Pyeon, 2020). Decreased GHG emissions from light farming since 1990 was due to the continual reduction of emissions caused by rice cultivation, which is the main source of emissions, owing to the decrease in paddy cultivation area. The slowing down of increased emissions from the livestock sector since 2010 was due to the outbreak of diseases, such as foot-and-mouth disease, while the slight rise in 2017 (0.1 million tons CO2 equivalent, which indicated a 1.4% increase from the previous year) was the result of escalation of the number of cattle raised (Jang and Pyeon, 2020). In 1990, the share of GHG emissions from rice cultivation was 10.5%, which was almost twice of that from livestock farming, i.e., 5.6%. In 2017, the share of GHG emissions from rice cultivation was 6% and that from livestock farming was 8.6% (Ministry of Environment of Korea, 2020). In other words, all agricultural sectors contribute to GHG emissions, and carbon emissions can be reduced only if efforts for this are concentrated both in the livestock farming and crop agriculture sectors.
Based on the data from Jang and Pyeon (2020).
Greenhouse gas (GHG) emission in livestock sector
In the “Research on Development of Carbon-Saving Livestock Product Distribution Technology in Response to Global Warming” report of the Korea Rural Development Administration, carbon emissions generated during the production and distribution of major livestock (cattle and pigs) were calculated. The distribution of 1 kg beef was found to emit 2.1 g, 24.3 g, and 308 g of CO2 during 10 days of aging, 26 days of storage, and 3 days of display, respectively (Cho et al., 2015). This is roughly three times more than the CO2 emissions associated with curing, storing, and displaying 1 kg pork of the same weight. This is likely because beef takes about three times longer to mature and store than does pork. The carbon emissions during production, slaughtering, processing, and distribution of 1 kg raw Korean beef were 16.55 kg, 17.58 kg, 27.41 kg, and 27.75 kg, respectively. These values were about 7 to 8 times higher in the production and slaughtering stages and about 2.5 times higher in the processing and distribution stages than those for pork in these stages (Cho et al., 2015).
According to a report regarding carbon emissions generated during the distribution of domestic and imported beef, 1 kg Hanwoo beef was found to emit 27.75 kg carbon during the production and distribution stages and 1 kg US beef, 92 kg carbon during the distribution stage compared with the production stage, indicating that US beef generated about three times more carbon emissions during distribution than did Hanwoo beef (Cho et al., 2015).
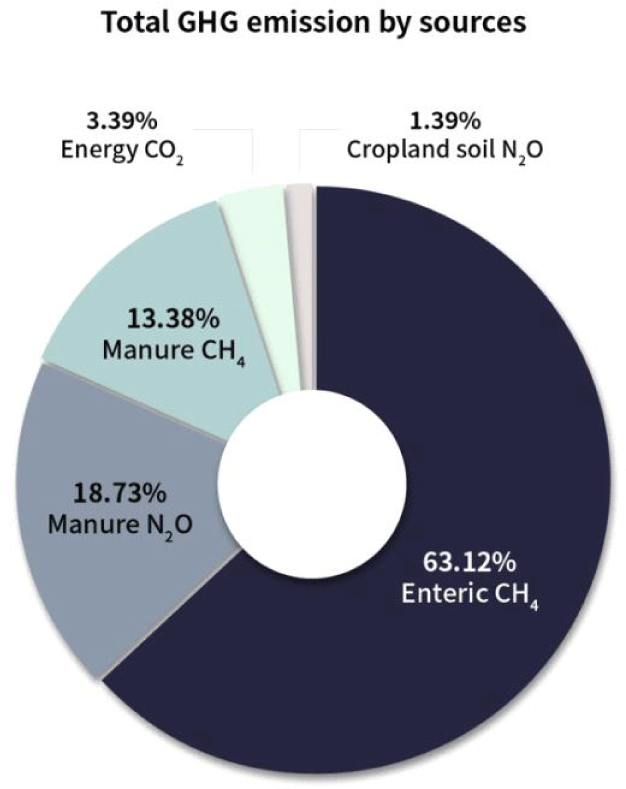
A previous case study based on beef production in Canada showed that in terms of the percentage of GHGs emitted during cattle raising, intestinal fermentation accounted for 63.12% (CH4) emission, while 18.73% (N2O) and 13.38% (CH4) emission came from manure. Meanwhile, in the energy sector, automobiles accounted for 3.39% (CO2) GHG emission, and the soil where feed crops are grown, 1.39% (N2O) GHG emission (Fig. 2) (Chen et al., 2020).
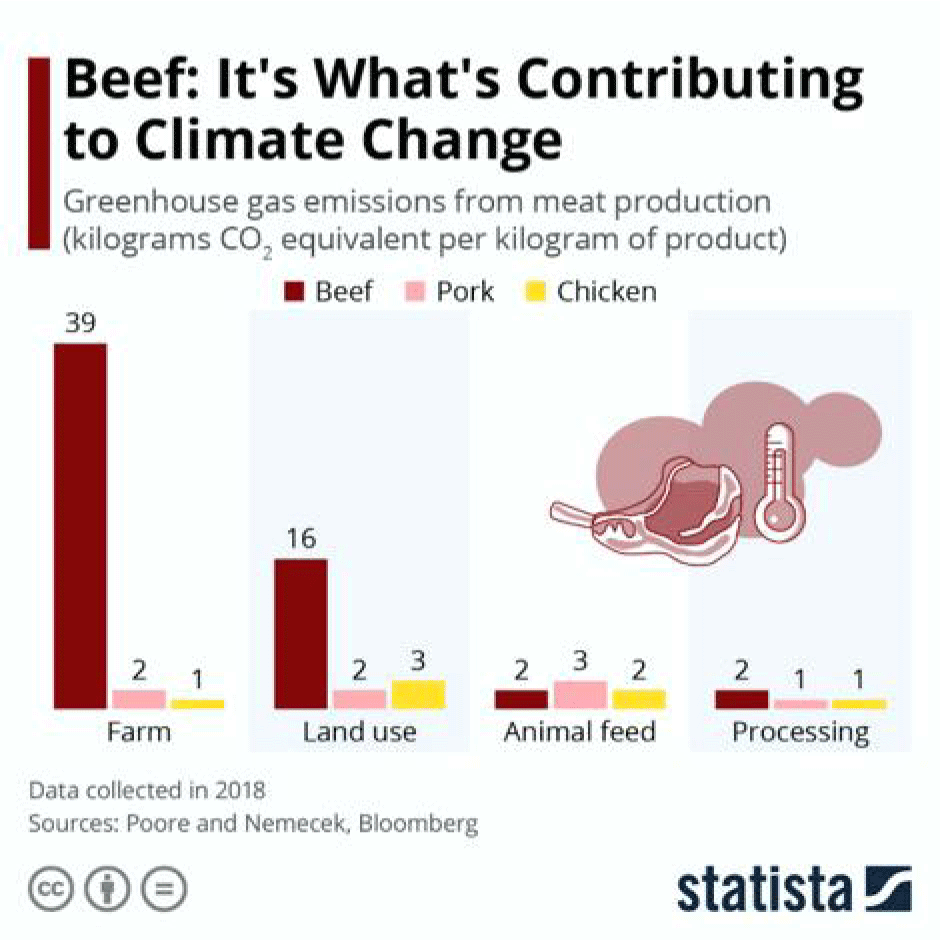
In the meat industry, production of 1 kg beef resulted in CO2 emissions of 39 kg on the farm, 2 kg during animal feed production, and 2 kg during processing. These values for pork were 2 kg on the farm, 3 kg during animal feed production, and 1 kg during processing. During chicken meat production, these values were 1 kg on the farm, 2 kg during animal feed production, and 1 kg during processing (Fig. 3) (Roper, 2020).
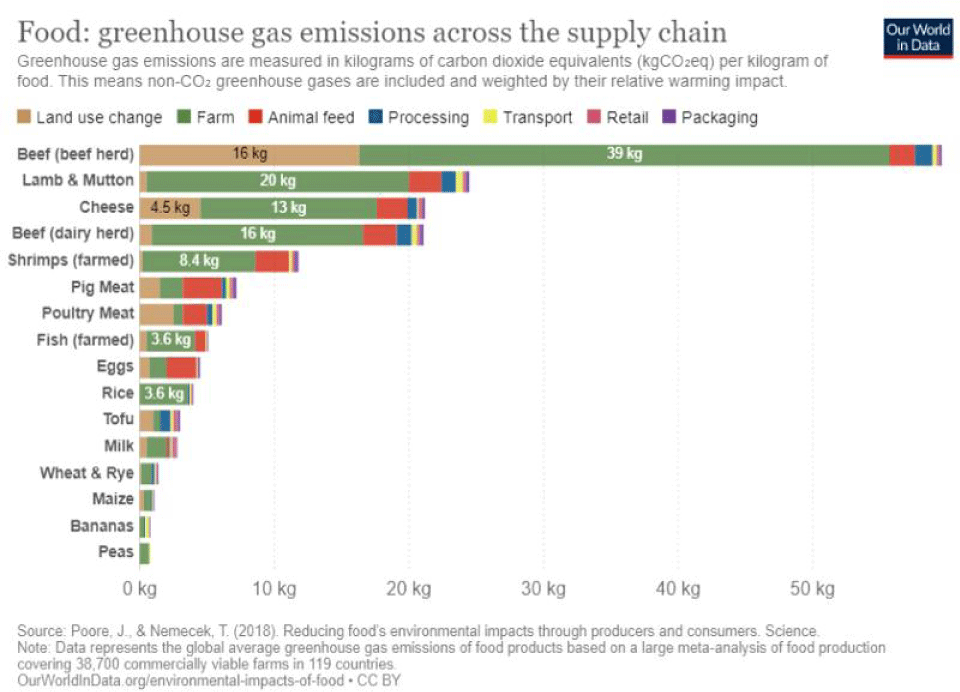
According to an Our World in Data report, GHG emissions due to the production of 1 kg food were 16 kg CO2 because of land use change and 39 kg from the farm in the case of beef production and approximately 12 kg GHG during the production of shrimp, which was more than that emitted during the production of 1 kg pork or chicken. Rice, which is the staple food in Korea, was also found to produce approximately 3.6 kg GHG per kg of rice (Fig. 4) (Poore and Nemecek, 2018).
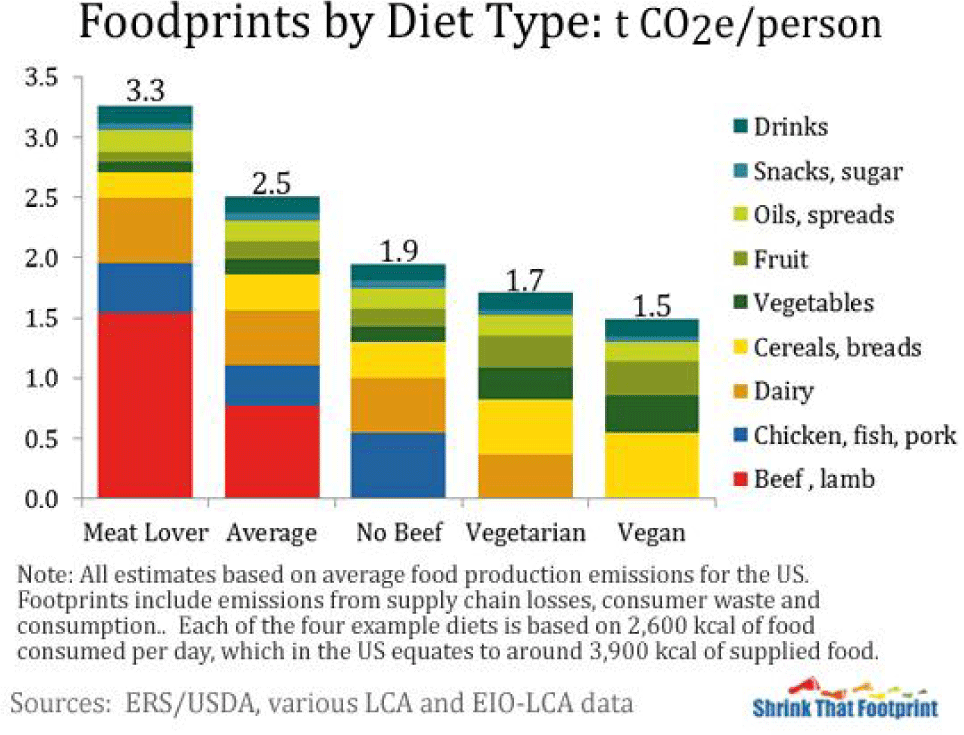
Based on data from the United States Department of Agriculture (USDA) and others, per capita CO2 emissions calculated using the food-consumption method showed that meat-eaters emitted 3.3 kg GHGs per day, while the average person emitted 2.5 kg GHGs per day; this value is close to that related to persons who do not consume beef (1.9 kg) and vegetarians (1.7 kg) (Poore and Nemecek, 2018). Vegans emitted 1.5 kg GHGs, which means that among all people, meat-eaters contribute to approximately 50% of the GHG emissions. Considering GHGs emitted during food production, 60 kg GHGs were required to produce 1 kg beef and 21 kg GHGs, to produce 1 kg cheese. Considering plants, 19 kg GHGs were required to produce 1 kg chocolate and 17 kg GHGs, to produce 1 kg coffee (Fig. 5) (Arnold et al., 2013).
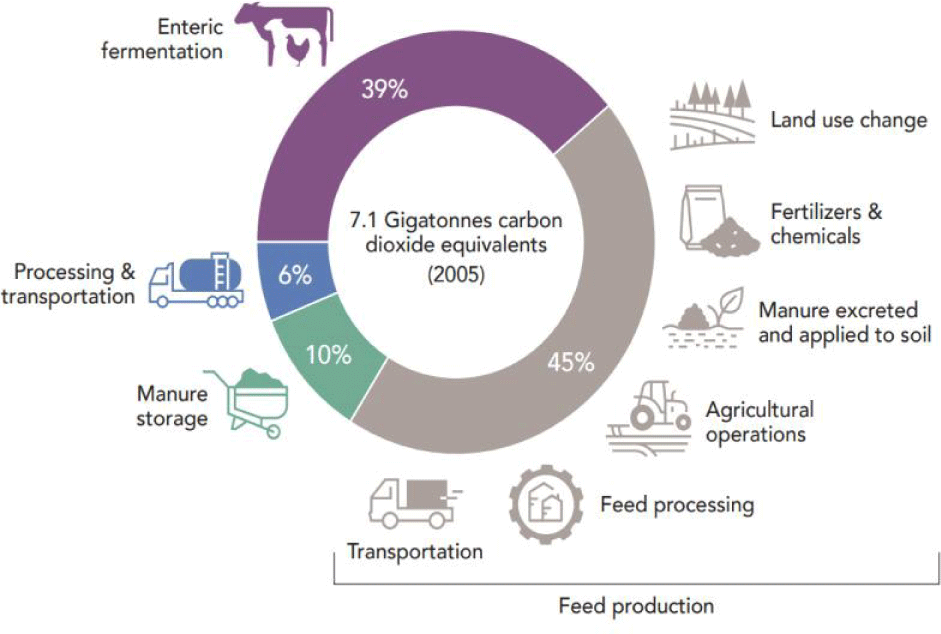
The Princeton University released a report stating that the percentages of GHGs emitted during the generation of livestock products were approximately 39% due to fermentation in the animal’s intestines; approximately 45% from land use, chemical fertilizers, manure/compost, feed production, transportation, and feed processing; and 10% from manure storage. Post-slaughter processing and transportation accounted for approximately 6% of the total GHG emissions (Fig. 6) (Gerber et al., 2013; Grossi et al., 2019). The GHG emission rate associated with the production of 1 kg poultry meat in a poultry farm was 1.26 kg from feed production, 0.55 kg from transportation, 0.28 kg N2O from manure, and 0.26 kg from farm energy (Dunkley and Dunkley, 2013). GHG emissions associated with the consumption of 1 kg eggs was 0.06 kg from processing, 0.35 kg from transportation, 0.13 kg from farm energy, and 0.53 kg from feed production (Vetter et al., 2018).
Conclusion
Korea is the 11th largest emitter of GHGs in the world, and this number is very close to its economic position. Hence, there is international pressure to reduce GHGs. Korea has announced a goal of reducing GHG emissions by 40% from the 2018 levels by 2030 to become carbon neutral by 2050.
Our review shows that the agricultural sector accounts for only 2.9% of GHG emissions and the livestock sector, for a very low 1.3%. However, the energy sector accounts for more than 80% of the total GHG emissions. These data show similar trends not only in Korea but also in other countries worldwide. It is also important to note that rice cultivation and other arable agriculture contribute more significantly to GHG emissions than does livestock farming. Therefore, to achieve carbon neutrality, efforts are needed in the agricultural sector and livestock industry, but the greatest effort would be required to convert the highest percentage of energy to renewable energy. Livestock was recognized as a major contributor of GHG emissions after the publication of the FAO’s “Livestock’s Long Shadow” report, which claimed that emissions from livestock are greater than those from the transportation sector and are a major contributor of land and water degradation (Steinfeld, 2006). However, the data we have researched and presented shows that while livestock is a source of GHG emissions, it is by no means the most significant one. Therefore, livestock must not be recklessly claimed as a major source of GHG emission. The implementation of carbon emission reduction policies centered around sectors associated with high GHG emissions based on accurate information obtained by collecting objective data is important to achieve carbon neutrality in 2050.
